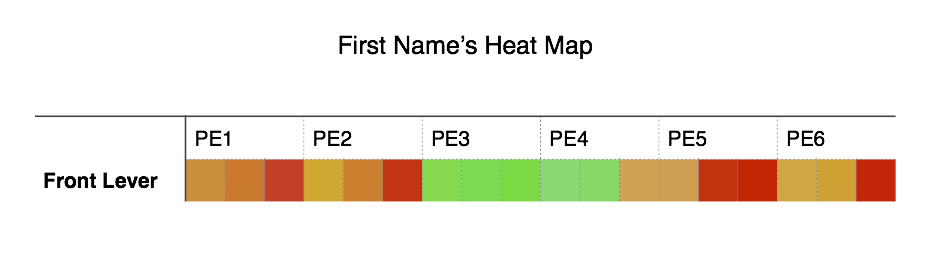
After discussing aspects of Allan's training with Coach yesterday, I had the idea of a visual form of analytics for our students. A heat map is a representation of the amount of time spent on each progression block compared to the whole of an element's development. The student can use this to better understand trouble areas that they may need to revisit or include as special maintenance.
Here's a (very) rough mockup of a F1 FL heat map.